Create a plot from a datafile
HPGeochemistry and HP-Output allow for making plots from output files. Plots are adapted when calculations are redone.
As an example, a plot is made from the output file of the HPGeochemistry example Exchange isotherm.
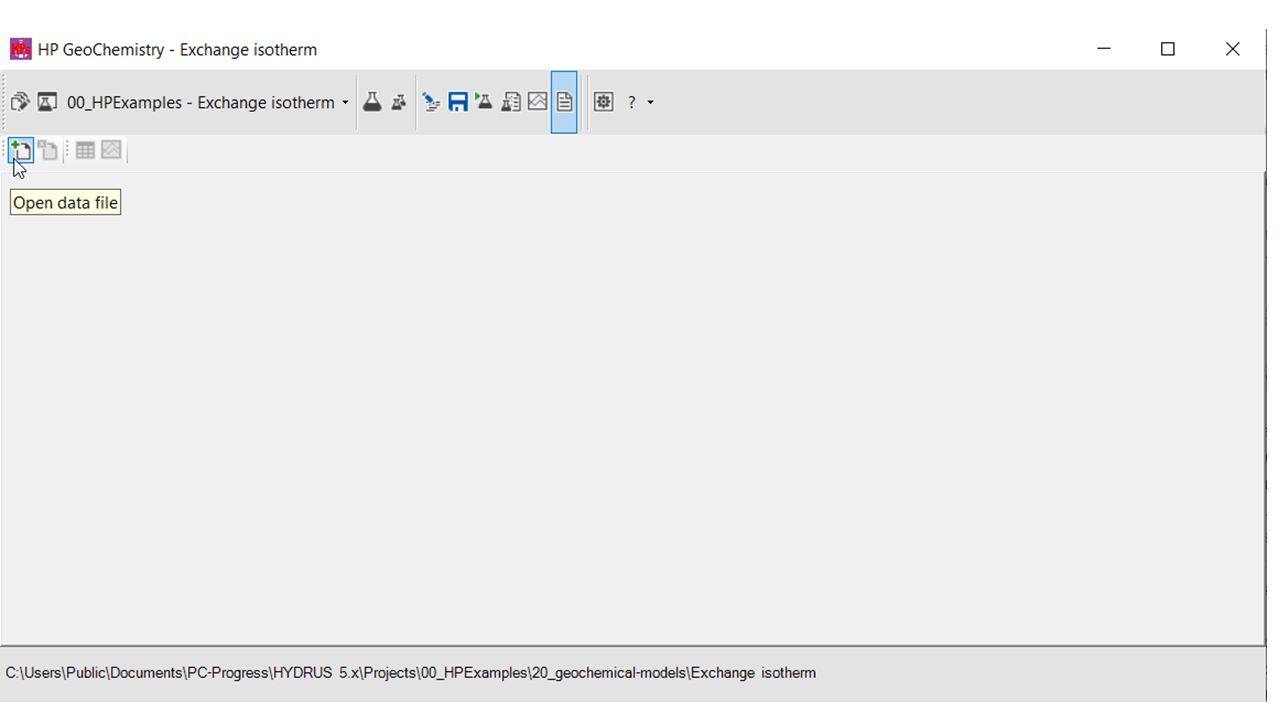
Open the datafile
In the Datafile Workspace, click the icon to open a datafile.
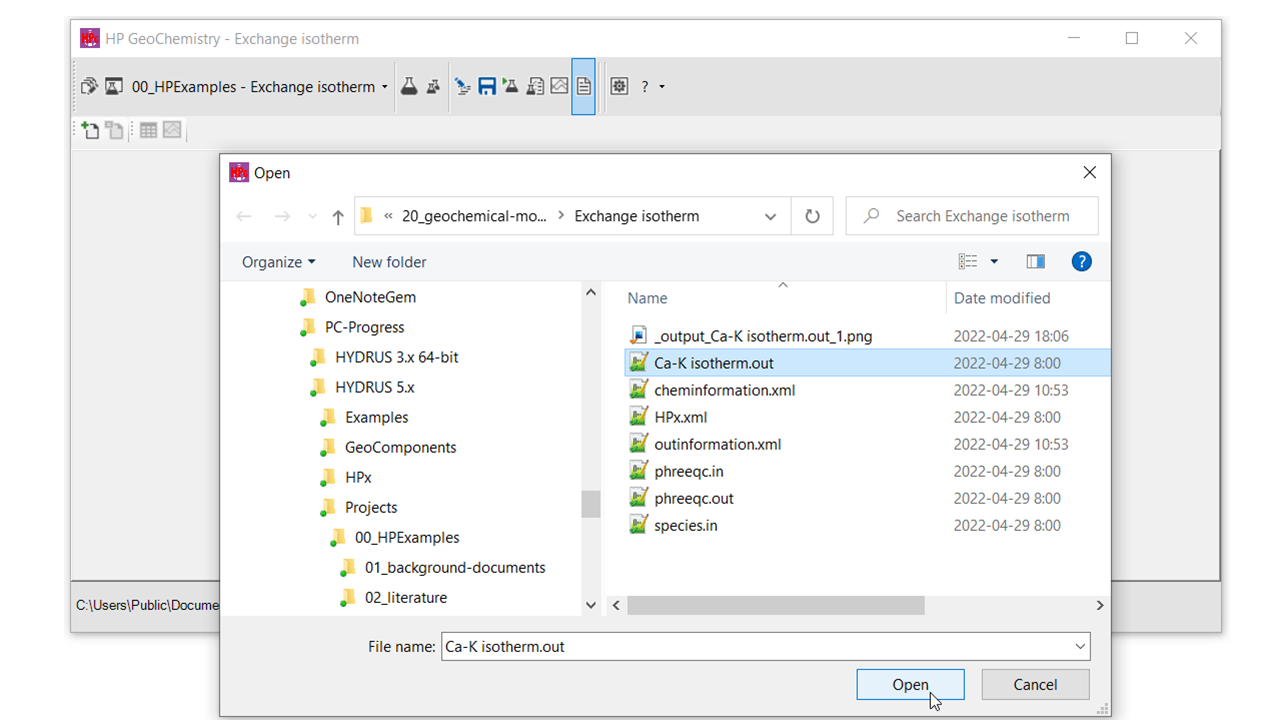
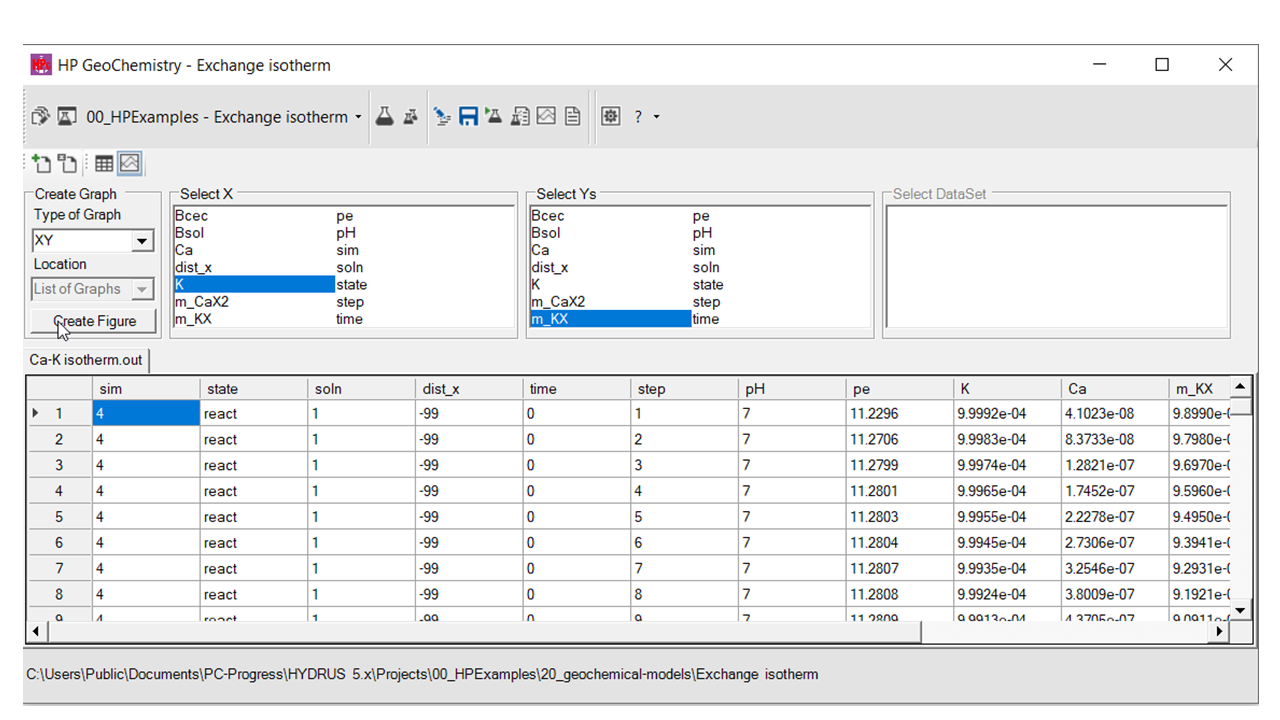
Select the datafile of interest (here Ca-K isotherm.out).
Make the plot and define the variables
Select the icon to make a plot.
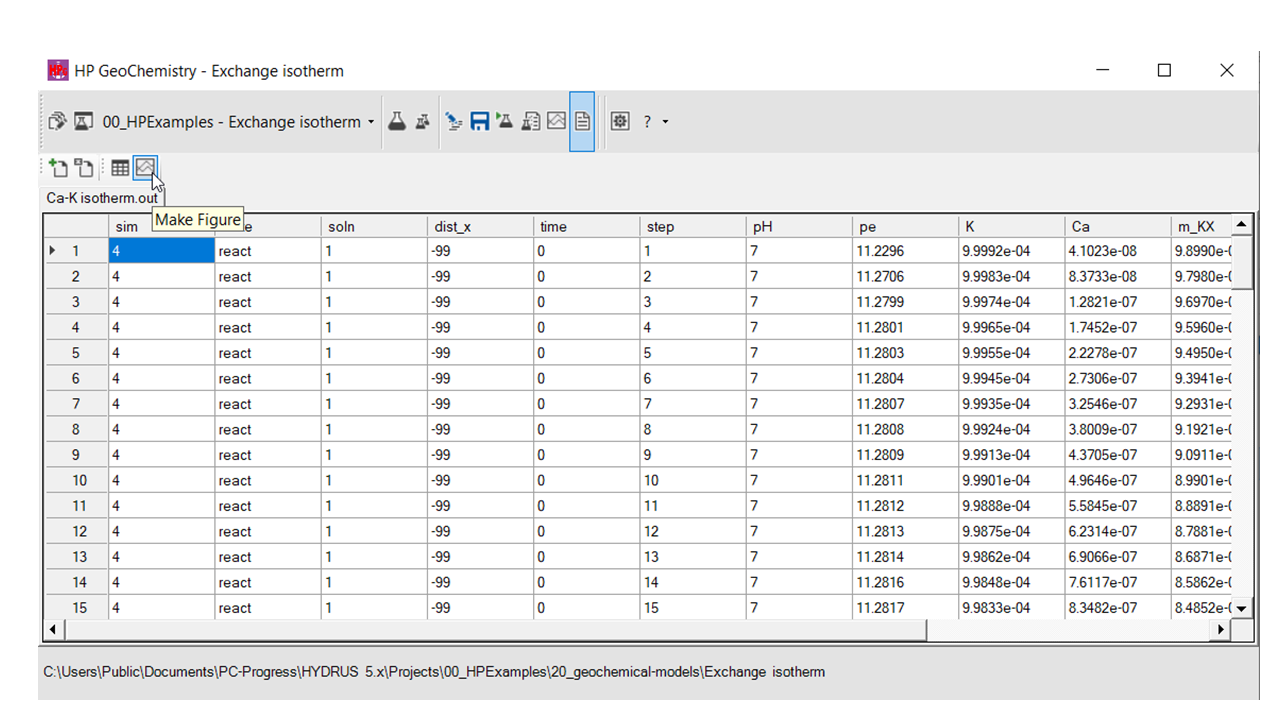
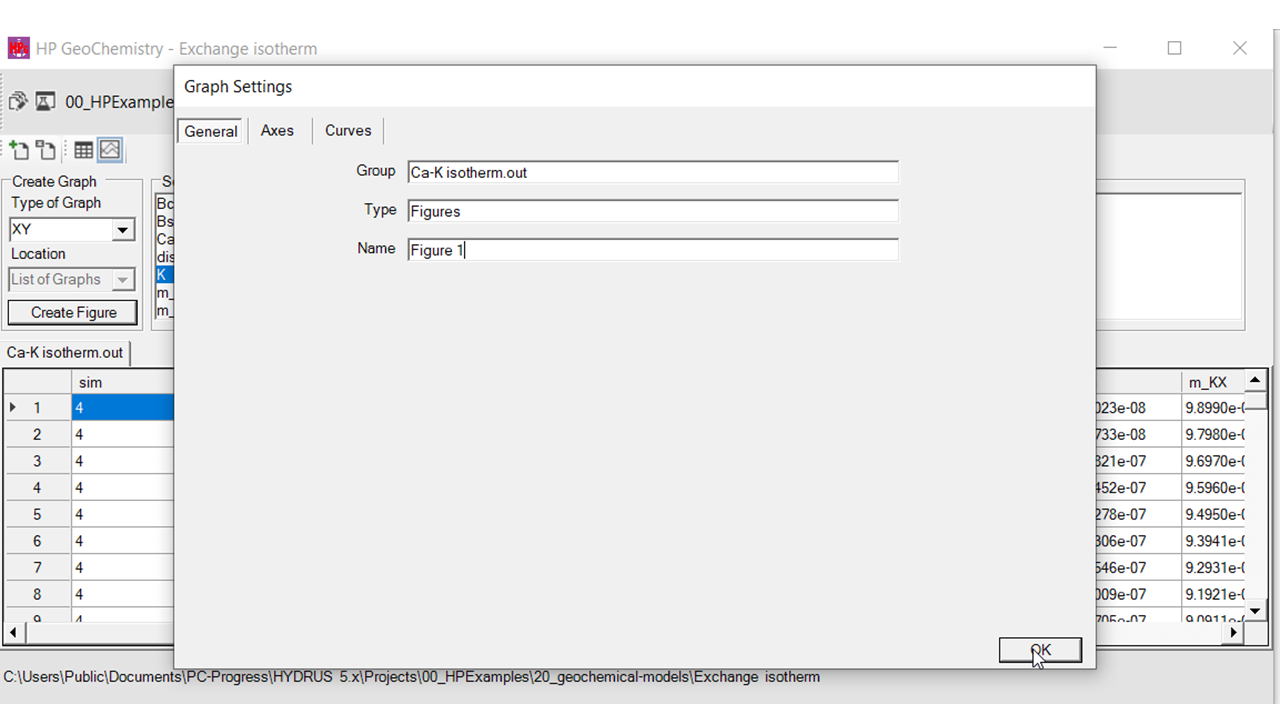
Select the X and Y variable and push the Create Figure button.
Adapt axes and curve options.
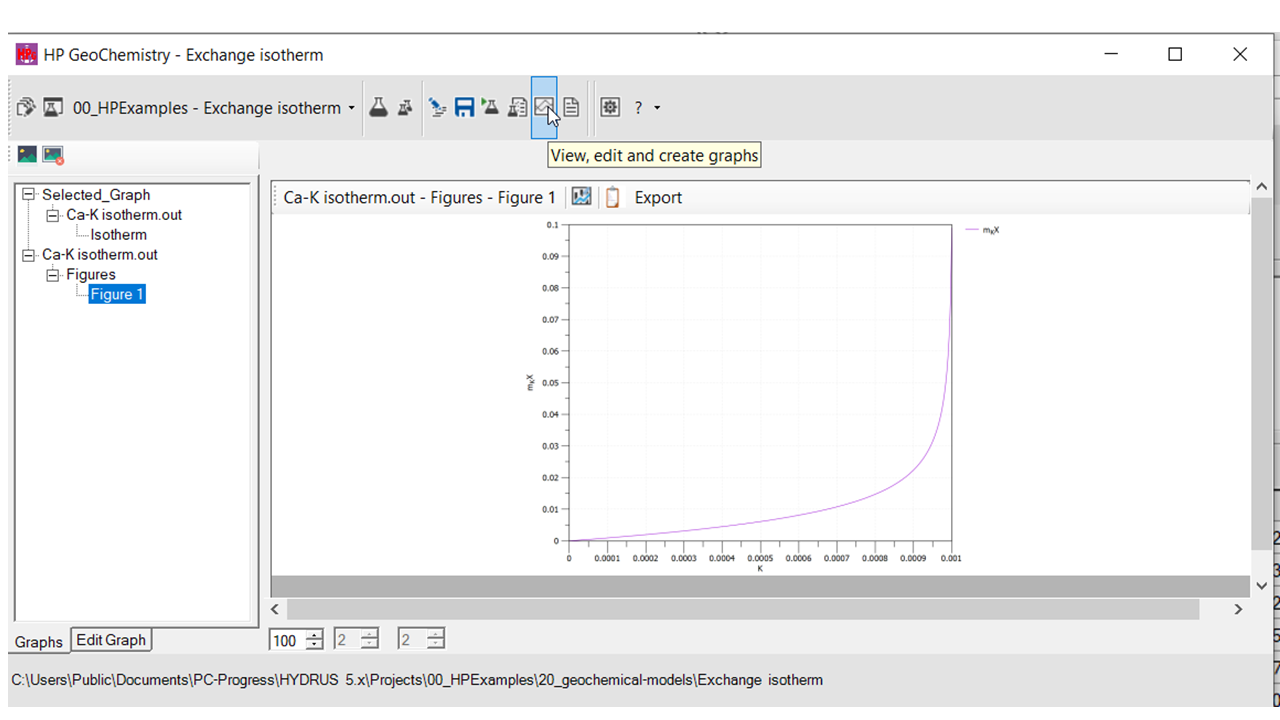
Visualize the plot
Go to the Graph Workspace and select the plot.