Profiles (reactive transport)
One-dimensional transport calculations
Profiles with different geochemical variables at selected times on one plot are made by
-fig_type profile
By default, the distance is the Y-variable. Following option will plot the distance along the X axis:
-fig_type profile flip
Selection of the times
The selection of the times for which the data is added to the curve is with the -fig_multi identifier. The selection of the times is the first input of the identifier.
Multiple times and variables on one plot
By default, a plot is made for each print time. The identifier -fig_multi allows also to indicate if a single plot is made with different variables and different print times when single is indicated
This plot consists of different variables at print times 2 and 4. Note that the first input cannot be omitted. Further options for the single plot are listed below.
Format of the dependent variable (distance)
The format of the dependent variable can be changed as:
- Numerical transformation in which _THIS is replaced by the value:
-fig_multi l2,4 profile transform "-_THIS"
- The label of the independent variable
-fig_multi l2,4 profile label "Distance below the soil surface"
- The unit of the independent variable
-fig_multi l2,4 profile unit "centimeter"
Options for the single plot
Options are added to the -fig_multi identifier after the input for selecting the times and when single is in the list as well.
With group, the outer and inner loops are defined:
-fig_multi l2,4 single group profiletimes
-fig_multi l2,4 single group independent
-fig_multi l2,4 single group variables
The first line will use the times in the outer loop and the variables (-fig_curve and -fig_curves) as an inner loop. The second line does the same (indicating that the independent variable is used as the outer loop)
The third line will use the variables as the outer loop and the times as the inner loop.
profiletimes and variables determine the curve property that will make the distinction. Color, dash and marks will, respectively, change color, dashtype and pointtype between the different curves in a group. For example:
-fig_multi l2,4 single profiletimes color 1 variables dash 1
will use different colors between the times (starting with the color of linetype 1), and different dash types for the between the different variables (starting with dashtype 1)
If another unit is to be used for the dependent variable, the unit can be added to profiletimes:
-fig_multi l2,4 single profiletimes color 1 "d"
-fig_multi l2,4 single profiletimes "d"
The first option adds a string variable after the indicators for the curves options; the second options only defines the unit, and keep the curve options to their default settings. A second profiletimes can be added with only the curve options.
The keyentry input will simplify the key entries by grouping the outer loop as subtitles in the legend.
-fig_multi l2,4 single keyentry "{/:Bold _LABEL}"
The subtitle format between quotes is optional. In this example, enhanced text mode is used to have bold subtitles (see gnuplot manual for the format). _LABEL is replaced by the key of the outer loop (print times or variables).
Examples
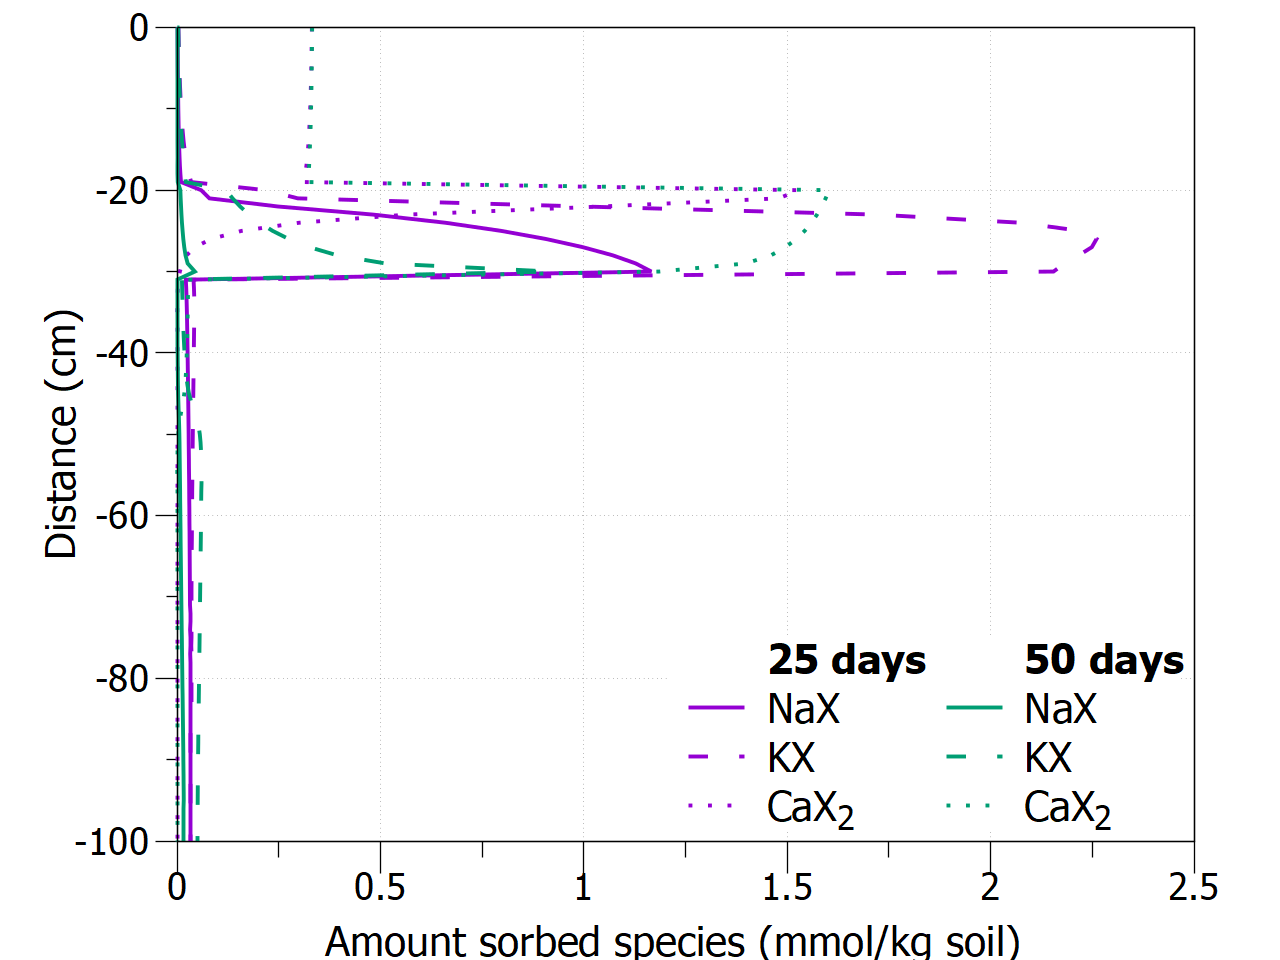
The figures below are made for the example with a three layered soil profile initially having a cation exchange complex in equilibrium with a Na-K-Cl solution and leached with a Ca-Cl solution - see
The calculated molalities of the exchange species (NaX, KX, and CaX2) are transformed to mmol/kg soil (in USER_PUNCH with headings NaXm, KXm and CaX2m). For two print times (print time 1 and 2, corresponding to 25 and 50 days), a combination plot with the three transformed variables is defined.
Hereafter, different options are illustrated. Following general settings are used
|
SELECTED_GRAPH 1 -start set for [i = 1:8] lt i lw 3 pt 2 set xtics font ",20" set ytics font ",20" set xlabel font ",22" offset -1 set ylabel font ",22" offset -1 set key inside bottom font ",22" set size ratio 0.8 -end |
|
|
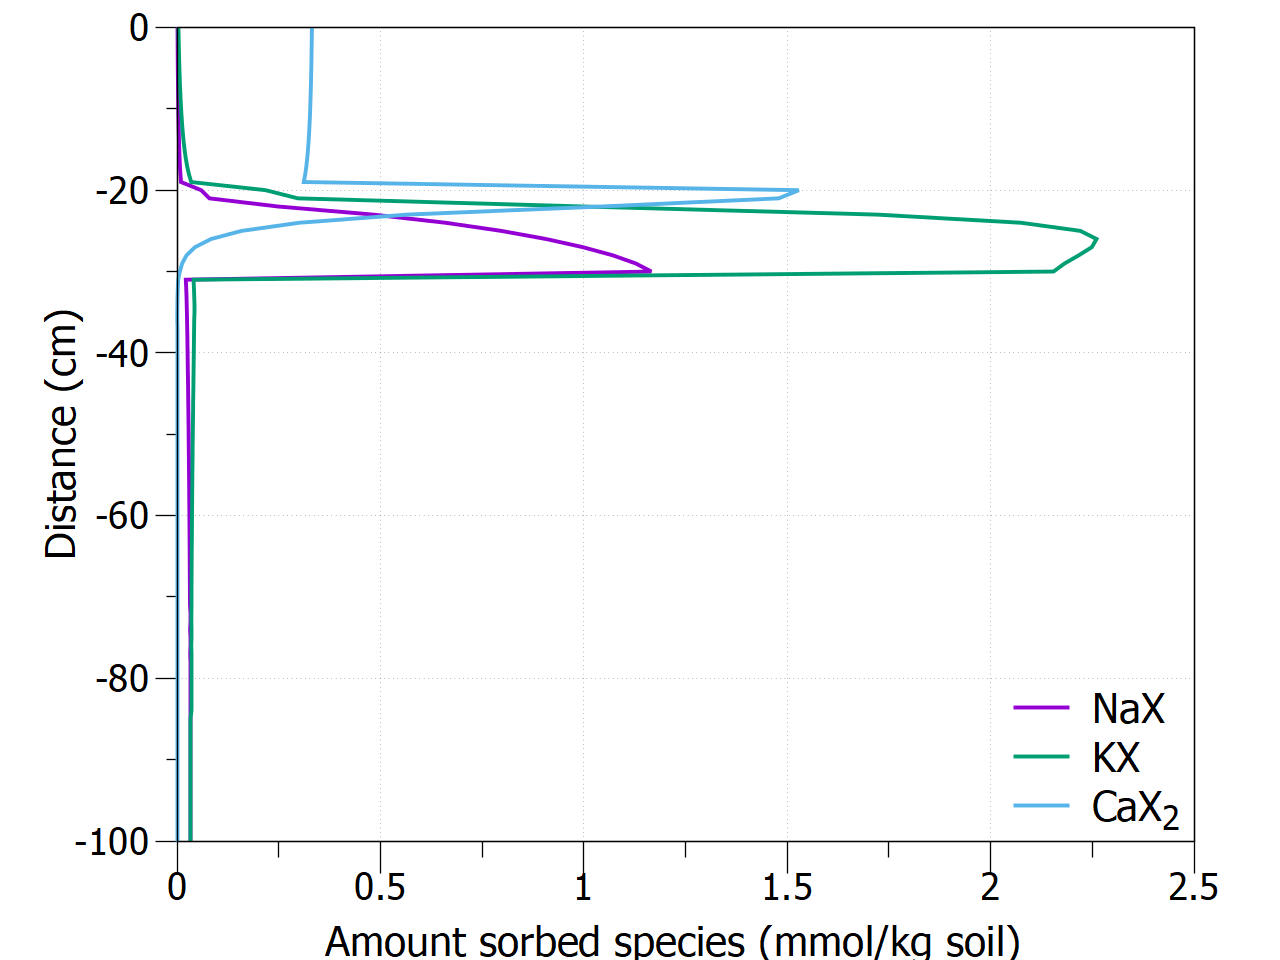
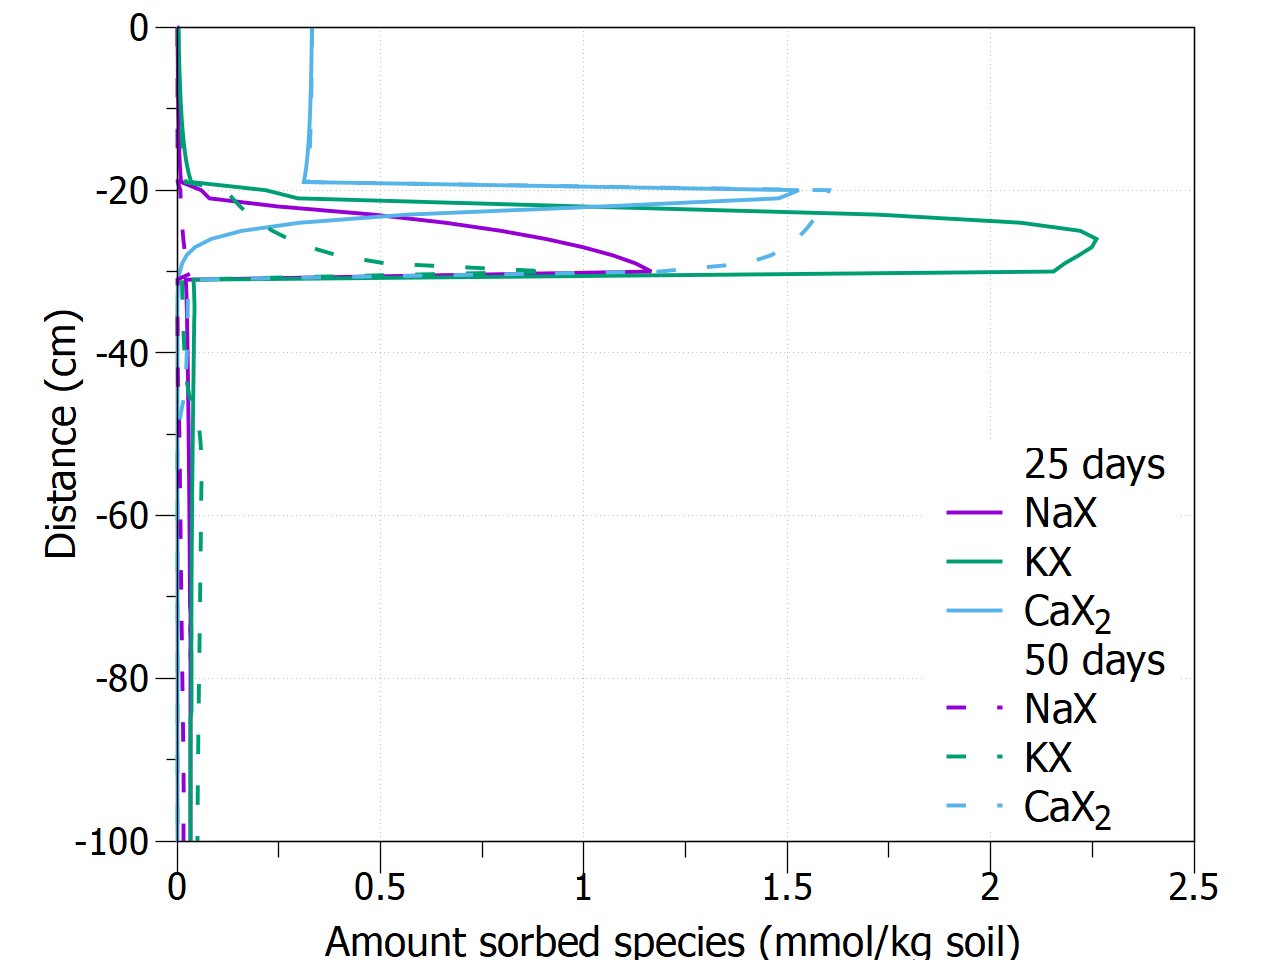
The default options
result in 2 graphs (01 Defaults 25 days,01 Defaults 50 days) illustrated here for the plot after 25 days |
|
|
|
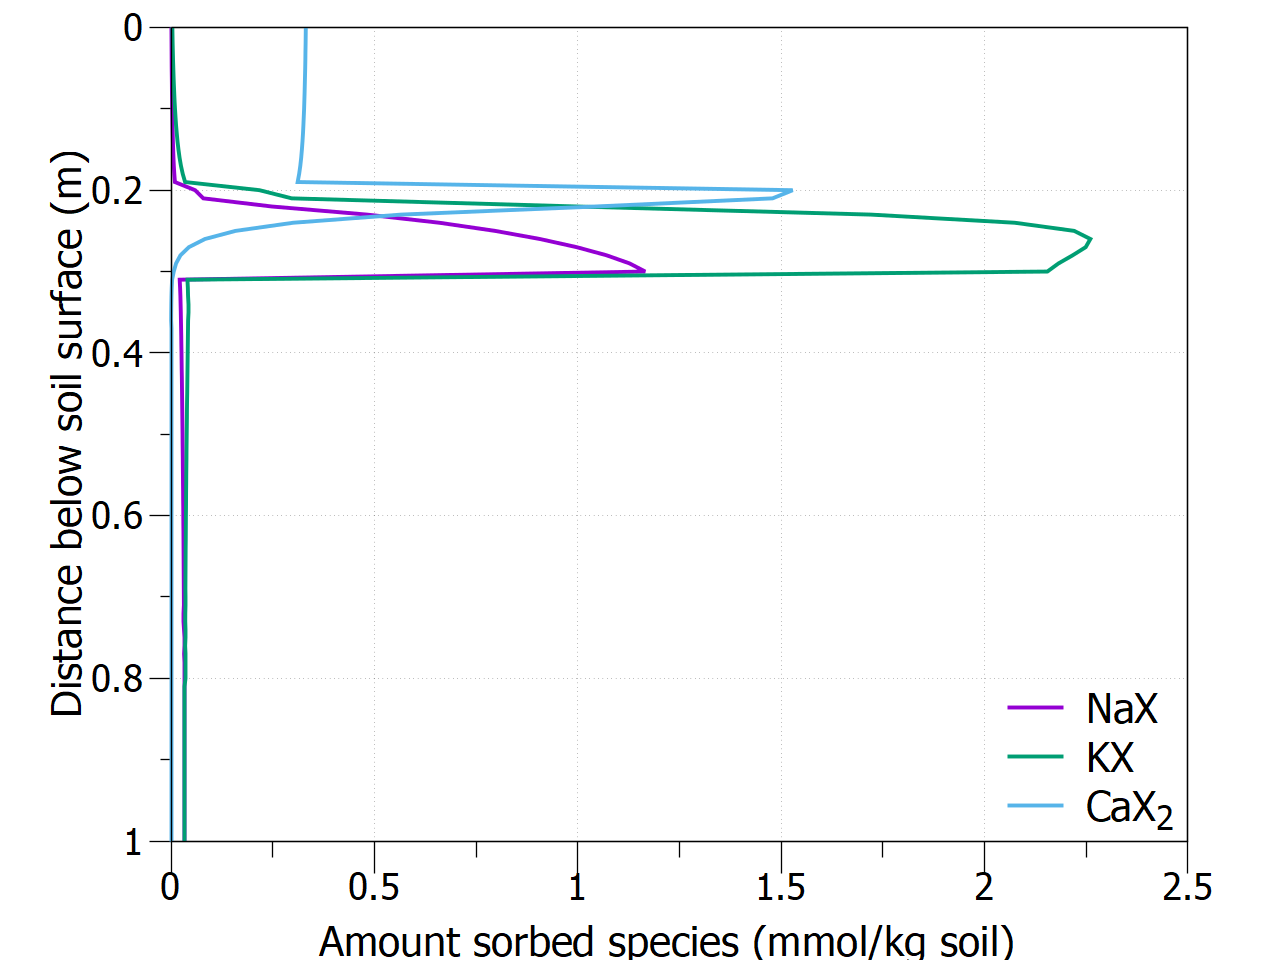
Additional options after -fig_multi allows for adapting the independent variable (Y-axis, depth)
This results in 2 graphs (02 Changed distance axis 25 days, 02 Changed distance axis 50 days) illustrated here for the plot after 25 days. |
|
|
|
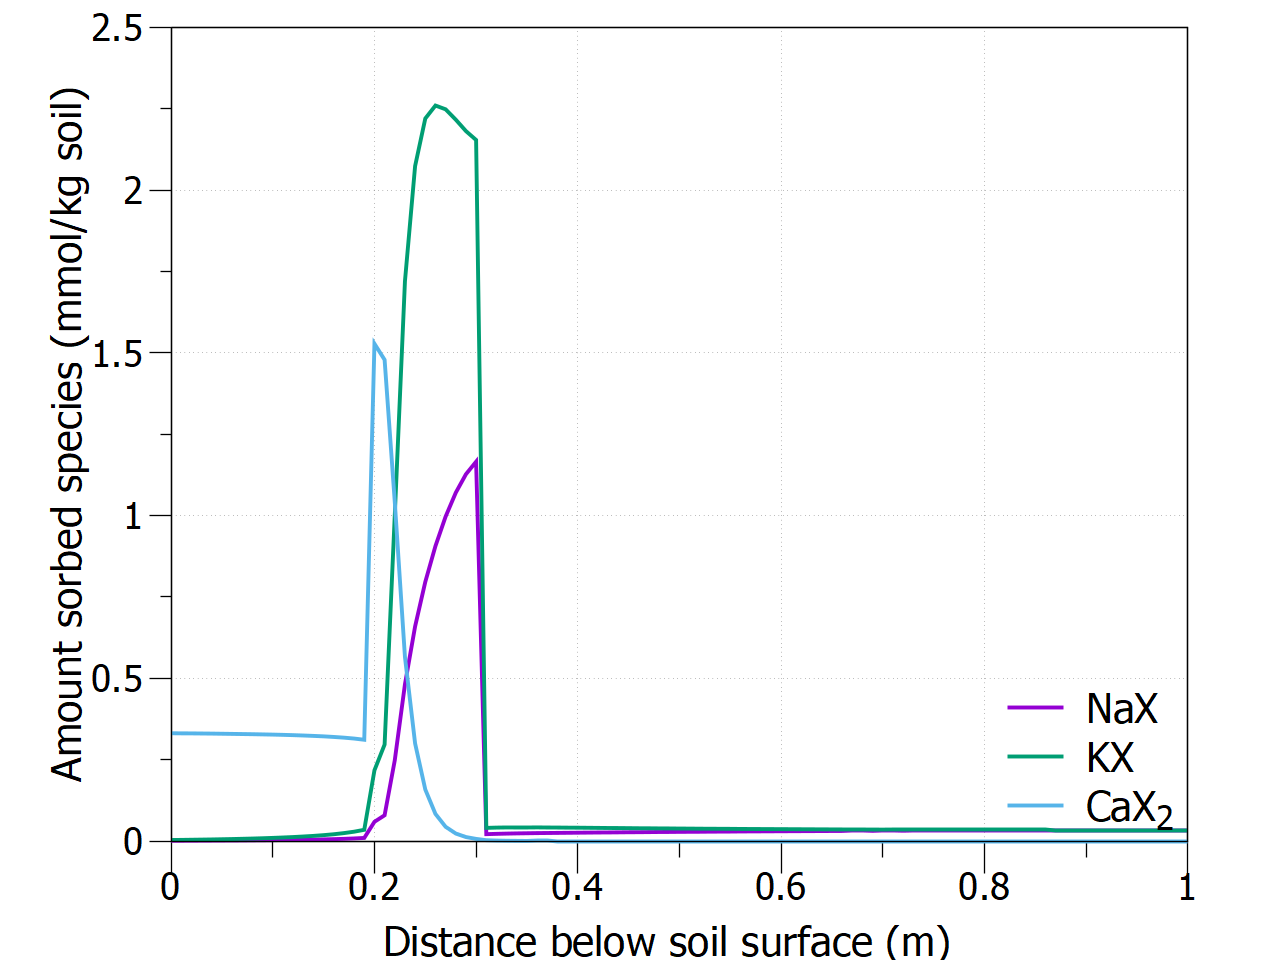
The distance is changed to the X-axis by adding the indicator flip after -fig_type.
This results in 2 graphs (03 Flipped distance axis 25 days, 03 Flipped distance axis axis 50 days) illustrated here for the plot after 25 days. |
|
|
|
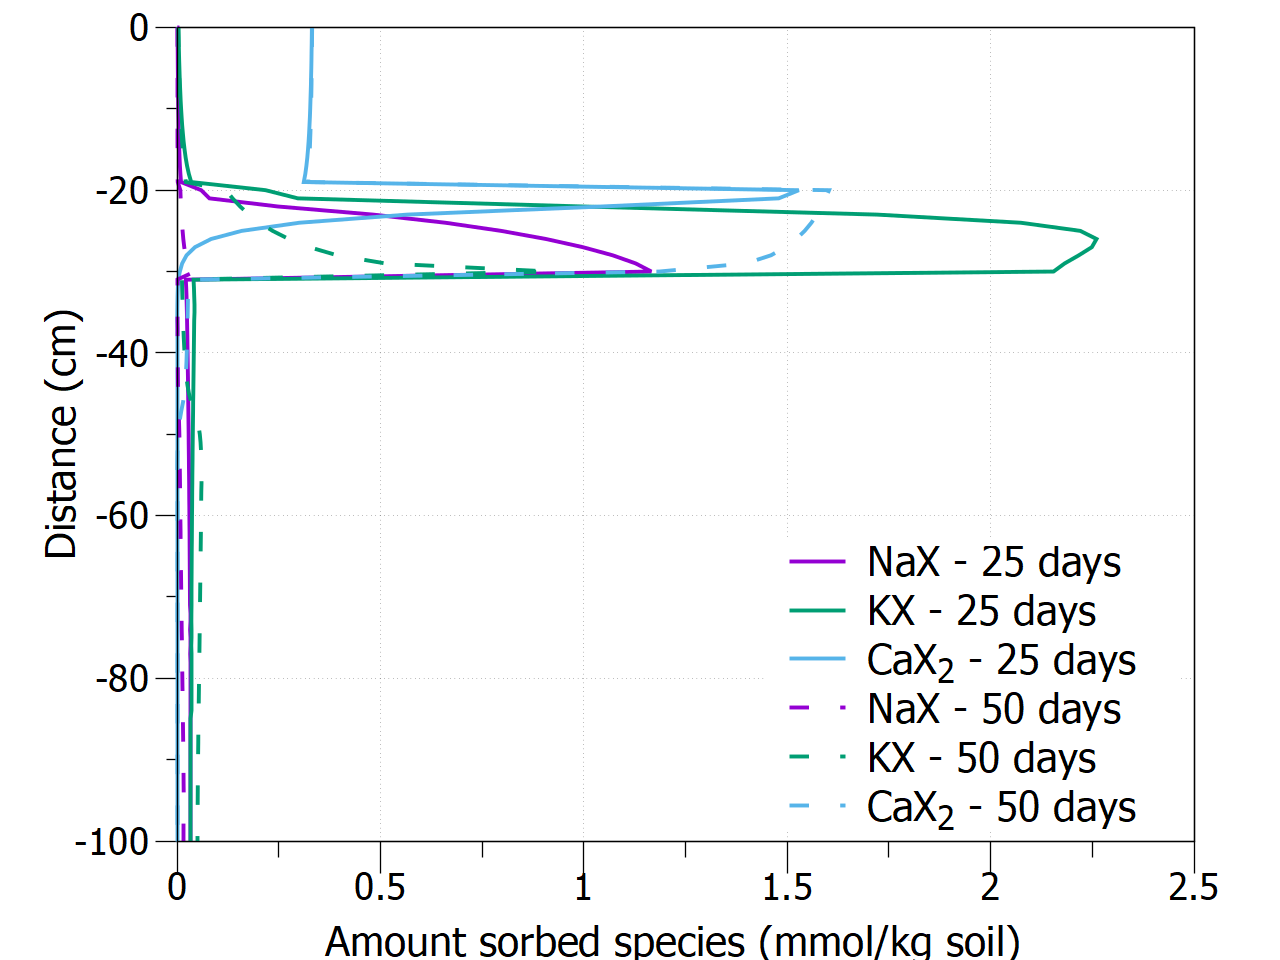
By adding single in the -fig_multi indicator, the variables and print times are combined in one plot. By default, the outer loop is over the print times, the dash type changes between print times, and the color changes between the variables.
This results in 1 graph (04 Combination default - 25 days, 50 days). |
|
|
|
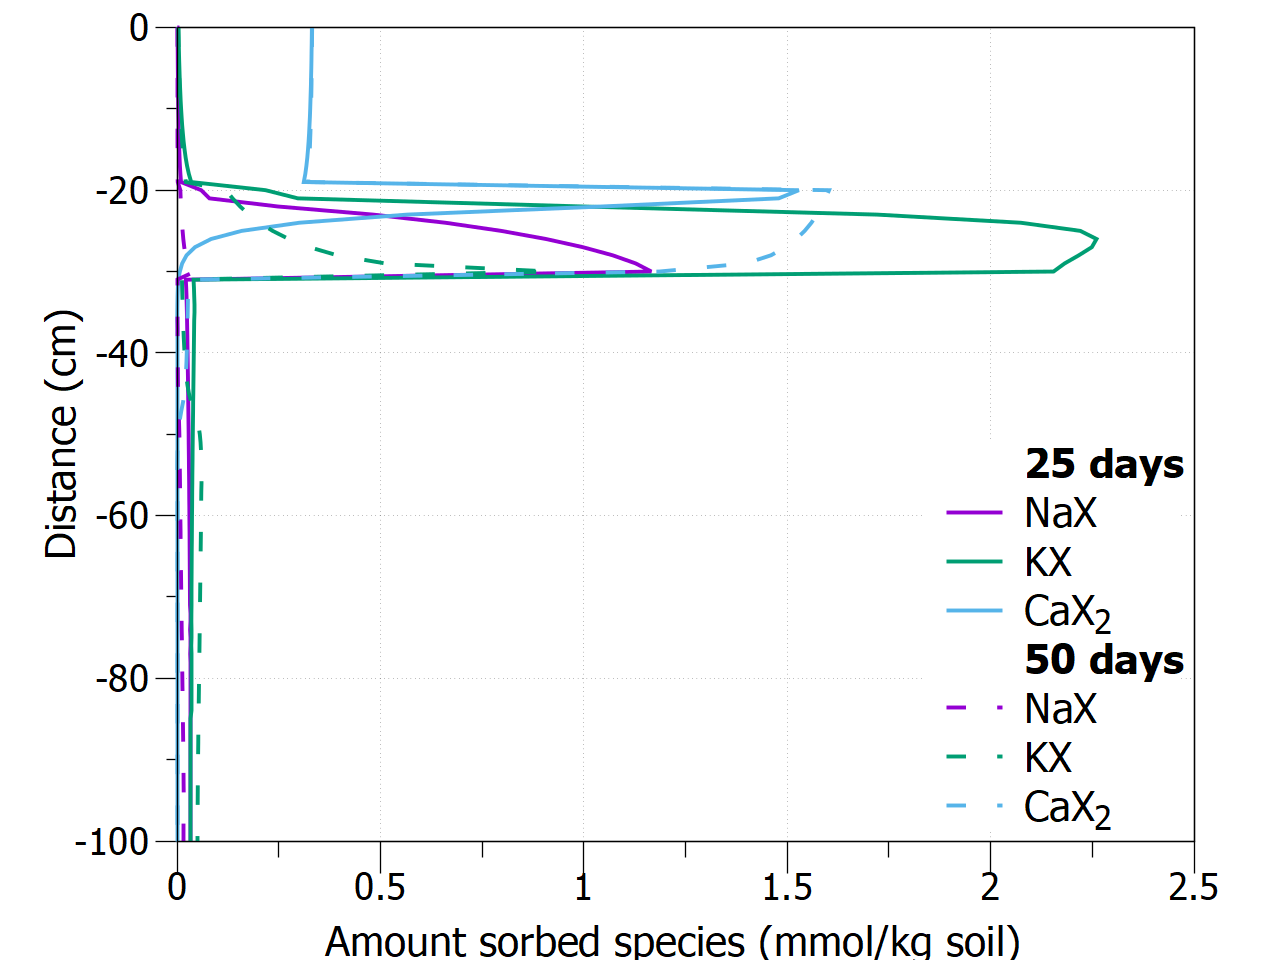
To simplify the legend, adding keyentry in the -fig_multi indicator, the outer loop variable (time in this case) will appear as subtitles in the legend. The time indicator is not included in the labels of the different keys.
This results in 1 graph (05 Combination key-entry - 25 days, 50 days). |
|
|
|
When keyentry is followed by a string variable, the subtitle will be created with the template; _LABEL is replaced by the outer variable. In this particular case, enhanced text mode is used to create a bold subtitle.
This results in 1 graph (06 Combination key-entry bold - 25 days, 50 days). |
|
|
|
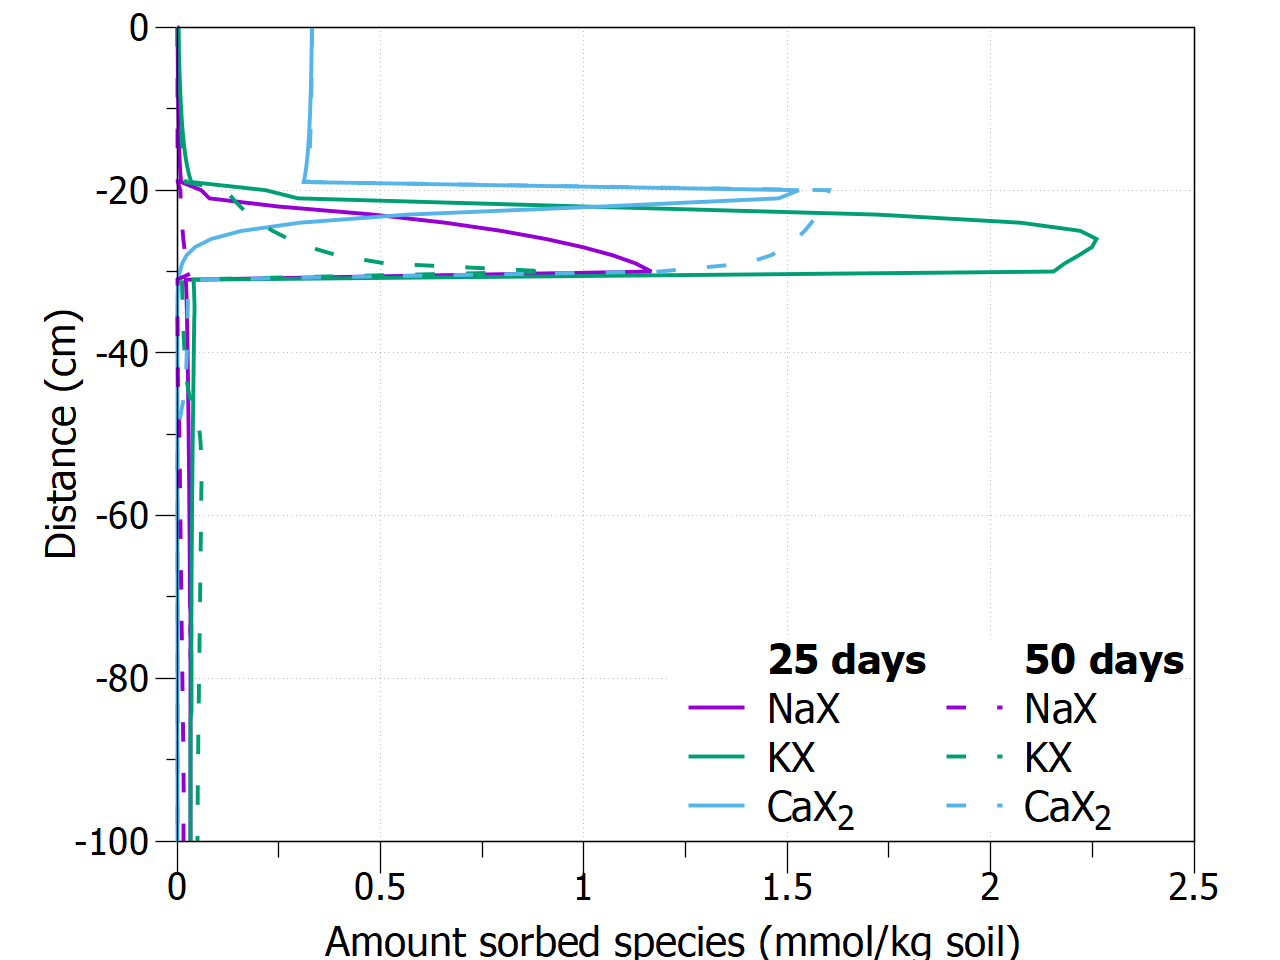
Using the maxrows option in gnuplot commands (in set key), the outer loop is forced to appear in different columns.
This results in 1 graph (07 Combination key-entry maxrows - 25 days, 50 days). |
|
|
|
Using the group option in the -fig_multi indicator, the outer loop can be defined being either the profiletimes (default) or the variable. The unit for the profile times can be changed, adding the profiletimes followed by a string variable (here "days" is replaced by "d")
This results in 1 graph (08 Combination group variable - 25 d, 50 d). |
|
|
|
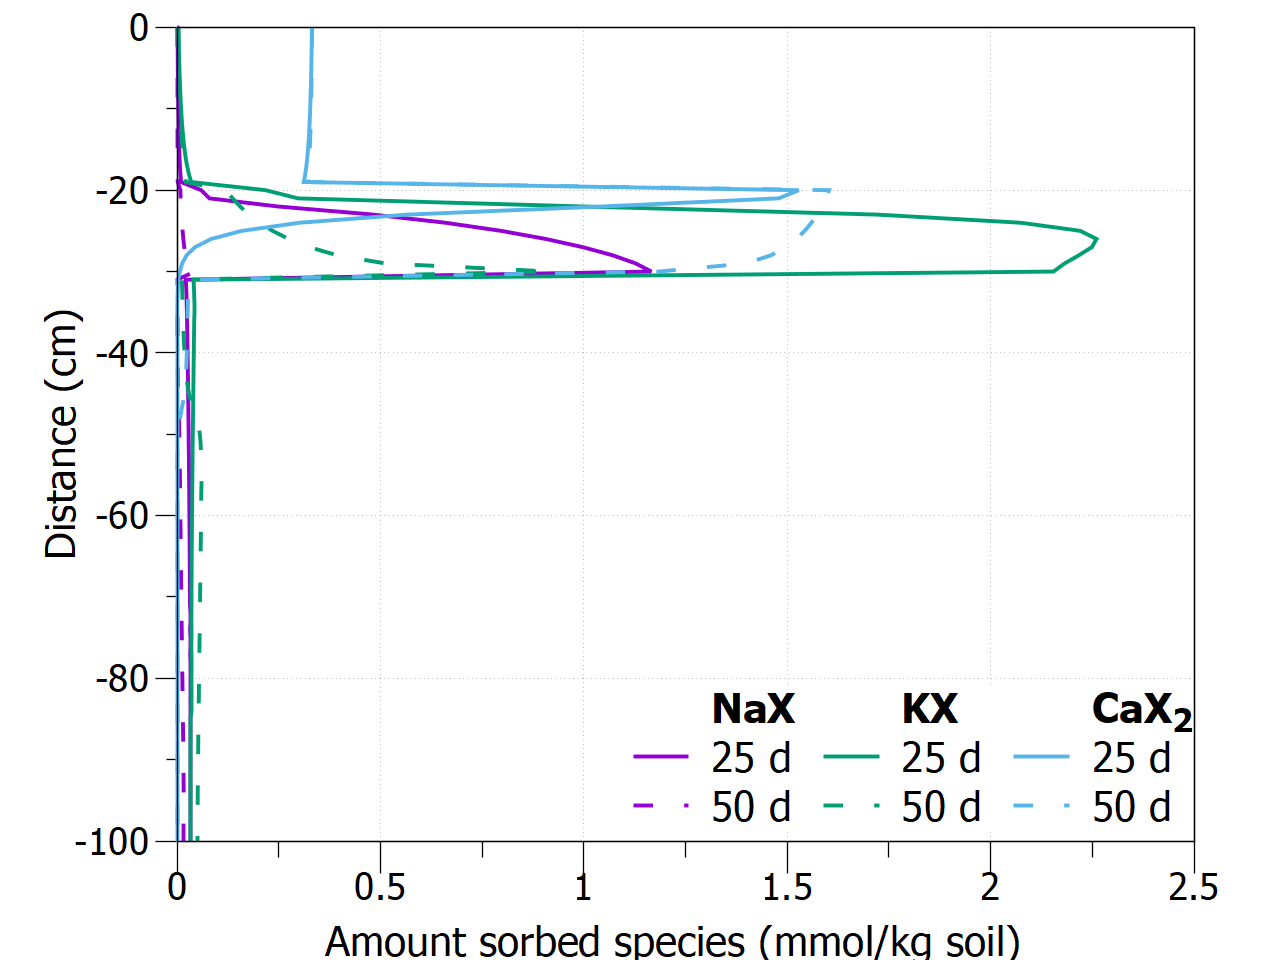
Instead of changing the dash type between print times, and the color between the variables, the reverse can be asked using profiletimes and variable options in the -fig_multi indicator. In the exampel, color will change between print times and dash type between variables, both starting from a value of 1.
This results in 1 graph (09 Combination dash-color - 25 days, 50 days). |
|
|
|
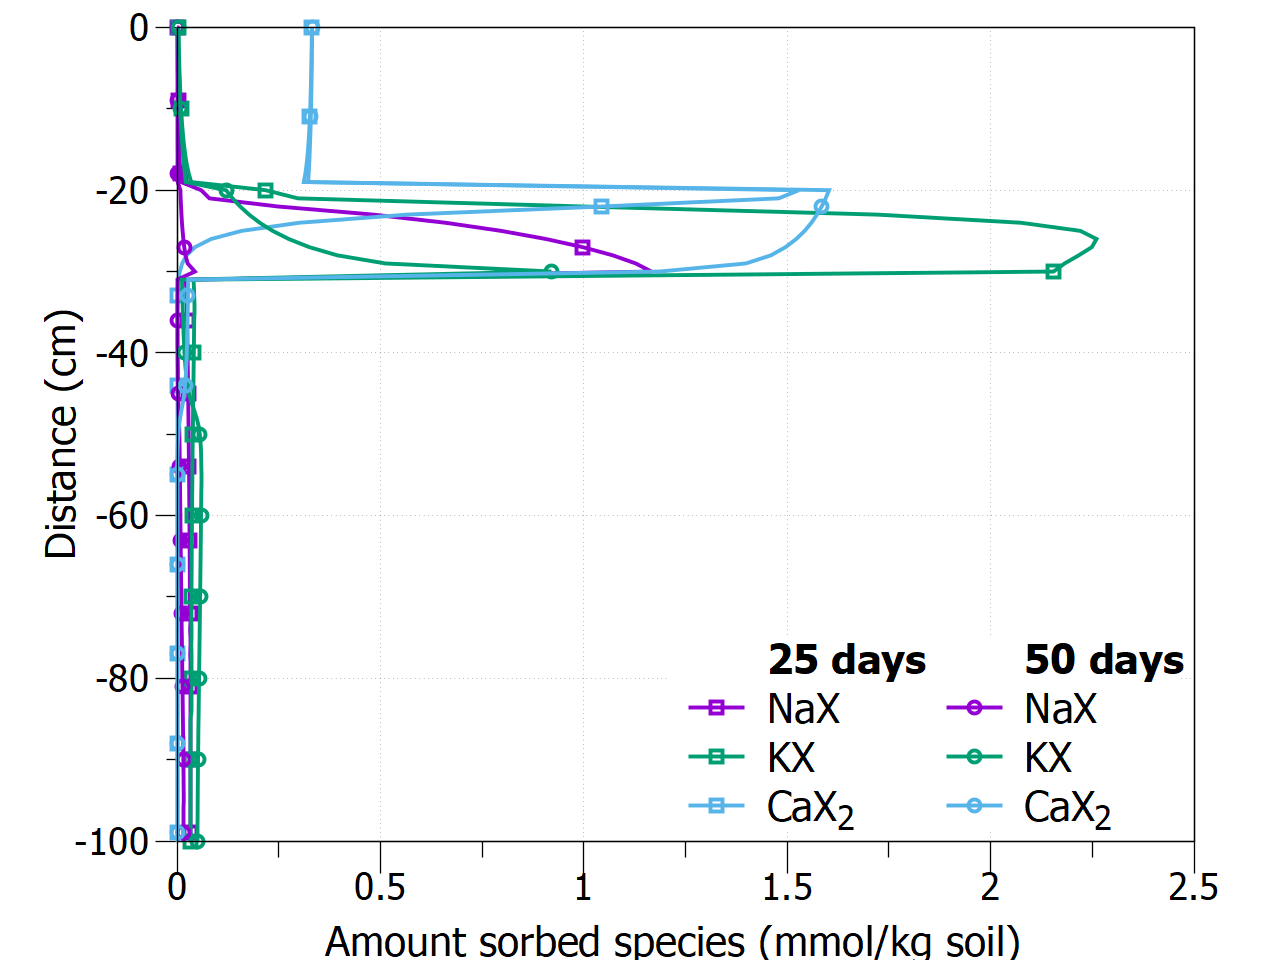
The option mark will change the point type, here between the print times.
This results in 1 graph (10 Combination mark-color - 25 days, 50 days). |